Loading...
Searching...
No Matches
gallery_treemap_hierarchy.cpp
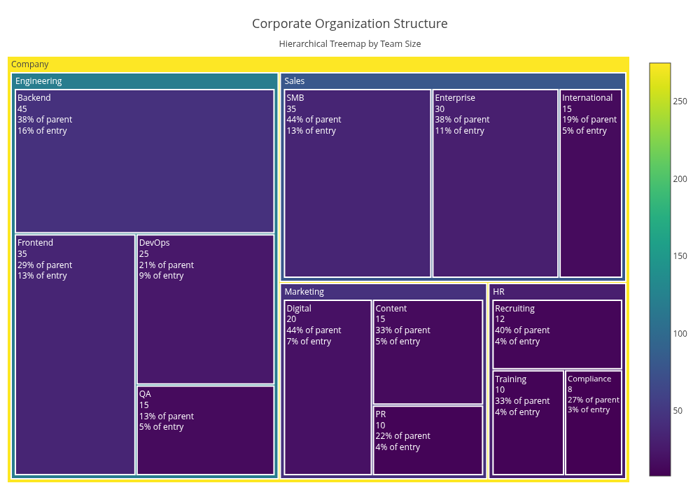
This gallery example demonstrates creating an interactive hierarchical treemap using Plotly.cpp to visualize corporate organizational structures. Treemaps excel at showing hierarchical data with proportional area representation, making it ideal for organizational analysis and resource allocation visualization.
Features demonstrated:
- Multi-level hierarchical data visualization using parent-child relationships
- Proportional area mapping representing team sizes within departments
- Interactive drilling down through organizational levels
- Custom colorscale (Viridis) for visual differentiation of hierarchy levels
- Rich hover templates showing team details and organizational context
- Configurable tree depth control for focused view management
- Custom text information display (labels, values, percentages)
- Professional layout with margins optimized for organizational charts
Organizational structure represented:
- Root: Company (275 total employees)
- Departments: Engineering (120), Sales (80), Marketing (45), HR (30)
- Teams: Frontend, Backend, DevOps, QA, Enterprise, SMB, etc.
- Complete hierarchical breakdown with accurate team size calculations
The treemap provides immediate visual understanding of organizational structure, team sizes, and departmental resource distribution, making it valuable for HR analytics and organizational planning.
Corporate Organization Treemap
#include "plotly/plotly.hpp"
#include "utils/arg_parser.hpp"
#include <string>
#include <vector>
// Parse command line arguments
plotly::Figure fig;
fig.openBrowser(args.headless);
// Corporate organizational data
std::vector<std::string> labels = {
"Company", "Engineering", "Sales", "Marketing", "HR",
"Frontend", "Backend", "DevOps", "QA", "Enterprise",
"SMB", "International", "Digital", "Content", "PR",
"Recruiting", "Training", "Compliance"};
std::vector<std::string> parents = {"",
"Company",
"Company",
"Company",
"Company",
"Engineering",
"Engineering",
"Engineering",
"Engineering",
"Sales",
"Sales",
"Sales",
"Marketing",
"Marketing",
"Marketing",
"HR",
"HR",
"HR"};
std::vector<double> values = {
275, // Company (root) - total of all departments (120+80+45+30)
120, 80, 45, 30, // Departments - total of their teams
35, 45, 25, 15, // Engineering teams (35+45+25+15 = 120)
30, 35, 15, // Sales teams (30+35+15 = 80)
20, 15, 10, // Marketing teams (20+15+10 = 45)
12, 10, 8 // HR teams (12+10+8 = 30)
};
// Additional information for hover
std::vector<std::string> descriptions = {
"Total Organization", "Software Development", "Revenue Generation",
"Brand & Growth", "People Operations", "UI/UX Development",
"Server & Database", "Infrastructure", "Quality Assurance",
"Large Enterprise", "Small-Medium Business", "Global Markets",
"Online Marketing", "Content Creation", "Public Relations",
"Talent Acquisition", "Employee Development", "Legal & Policy"};
// Create treemap trace
plotly::Object trace = {
{"type", "treemap"},
{"labels", labels},
{"parents", parents},
{"values", values},
{"text", descriptions},
{"textinfo", "label+value+percent parent+percent entry"},
{"textfont", {{"size", 12}}},
{"marker",
{{"colorscale", "Viridis"},
{"colorbar", {{"title", "Team Size"}, {"titleside", "right"}}},
{"line", {{"width", 2}}}}},
{"hovertemplate", "<b>%{label}</b><br>" +
std::string("Team Size: %{value} people<br>") +
"%{text}<br>" + "<extra></extra>"},
{"maxdepth", 3},
{"branchvalues", "total"},
{"pathbar", {{"visible", false}}}};
// Create layout
plotly::Object layout = {
{"title",
{{"text",
"Corporate Organization Structure<br>" +
std::string("<sub>Hierarchical Treemap by Team Size</sub>")},
{"font", {{"size", 18}}}}},
{"width", 1000},
{"height", 700},
{"margin", {{"l", 10}, {"r", 10}, {"t", 80}, {"b", 10}}},
{"annotations",
{{{"text", "Click on segments to drill down into departments"},
{"x", 0.5},
{"y", -0.05},
{"xref", "paper"},
{"yref", "paper"},
{"showarrow", false},
{"font", {{"size", 12}}}}}}};
// Create the plot
std::vector<plotly::Object> data = {trace};
fig.newPlot(data, layout);
if (!args.headless) {
fig.waitClose();
} else {
// Save image instead of opening browser
{"width", 1000},
{"height", 700},
{"filename", "treemap_hierarchy"}};
fig.downloadImage(imageOpts);
}
return 0;
}
auto parseGalleryArgs(int argc, char *argv[]) -> GalleryArgs
Parse command line arguments for gallery examples.
Definition arg_parser.cpp:4
void waitClose() const
Wait until the figure is closed (no client connected).
Definition plotly.cpp:406
auto downloadImage(const Object &opts=Object()) -> bool
Download the figure as an image.
Definition plotly.cpp:413
auto newPlot(const Object &data, const Object &layout=Object(), const Object &config=Object()) -> bool
Create and render a new plot.
Definition plotly.cpp:408
auto openBrowser(bool headless=false) -> bool
Open the figure in the browser.
Definition plotly.cpp:529
Public Plotly C++ API header.