Loading...
Searching...
No Matches
gallery_statistical_distributions.cpp
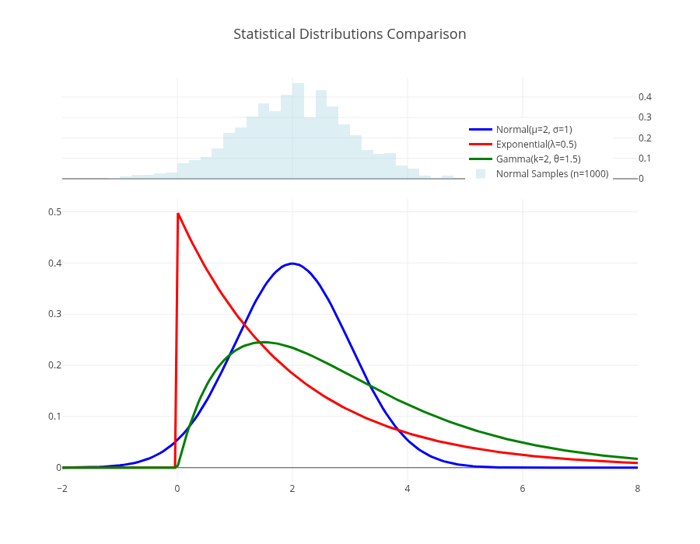
This gallery example demonstrates visualization of multiple statistical distributions using Plotly.cpp. It combines theoretical probability density functions with empirical histogram data to showcase both continuous distributions and sample-based analysis.
Features demonstrated:
- Multiple probability density function (PDF) implementations and plotting
- Theoretical vs. empirical distribution comparison using dual y-axes
- Custom mathematical function implementations for statistical distributions
- Histogram generation from random samples with density normalization
- Multi-trace plotting with different line styles and colors
- Dual y-axis configuration for comparing different data types
- Random number generation and statistical sampling techniques
Statistical distributions implemented:
- Normal distribution:

- Exponential distribution:

- Gamma distribution:

- Empirical normal samples: 1000 random samples for comparison


Mathematical concepts and formulas:
- Normal Distribution PDF:
![\[ f(x|\mu,\sigma) = \frac{1}{\sigma\sqrt{2\pi}}
e^{-\frac{1}{2}\left(\frac{x-\mu}{\sigma}\right)^2}
\]](form_25.png)
- Exponential Distribution PDF:
![\[ f(x|\lambda) = \lambda e^{-\lambda x} \quad \mathrm{for } x \geq 0
\]](form_26.png)
- Gamma Distribution PDF:
![\[ f(x|k,\theta) = \frac{x^{k-1}e^{-x/\theta}}{\Gamma(k)\theta^k} \quad
\mathrm{for } x > 0
\]](form_27.png)
- Random sampling and empirical distribution estimation
- Statistical distribution parameters and their effects on shape
- Gamma function:
![\[ \Gamma(k) = \int_0^\infty t^{k-1}e^{-t}dt
\]](form_28.png)
![\[ f(x|\mu,\sigma) = \frac{1}{\sigma\sqrt{2\pi}}
e^{-\frac{1}{2}\left(\frac{x-\mu}{\sigma}\right)^2}
\]](form_25_dark.png)
![\[ f(x|\lambda) = \lambda e^{-\lambda x} \quad \mathrm{for } x \geq 0
\]](form_26_dark.png)
![\[ f(x|k,\theta) = \frac{x^{k-1}e^{-x/\theta}}{\Gamma(k)\theta^k} \quad
\mathrm{for } x > 0
\]](form_27_dark.png)
![\[ \Gamma(k) = \int_0^\infty t^{k-1}e^{-t}dt
\]](form_28_dark.png)
Statistical Distributions
Comparison"
#include "plotly/plotly.hpp"
#include "utils/arg_parser.hpp"
#include "utils/linspace.hpp"
#include <cmath>
#include <random>
#include <vector>
// Statistical distribution functions
double variance = stddev * stddev;
return (1.0 / std::sqrt(2 * M_PI * variance)) *
std::exp(-0.5 * std::pow(x - mean, 2) / variance);
}
return (x >= 0) ? lambda * std::exp(-lambda * x) : 0.0;
}
if (x <= 0)
return 0.0;
return std::pow(x, shape - 1) * std::exp(-x / scale) /
(std::tgamma(shape) * std::pow(scale, shape));
}
// Parse command line arguments
plotly::Figure fig;
fig.openBrowser(args.headless);
// Generate x values
// Calculate PDF values for different distributions
std::vector<double> normalY, exponentialY, gammaY;
normalY.reserve(x.size());
exponentialY.reserve(x.size());
gammaY.reserve(x.size());
for (const auto &xi : x) {
normalY.push_back(normalPDF(xi, 2.0, 1.0)); // Normal(μ=2, σ=1)
exponentialY.push_back(exponentialPDF(xi, 0.5)); // Exponential(λ=0.5)
gammaY.push_back(gammaPDF(xi, 2.0, 1.5)); // Gamma(k=2, θ=1.5)
}
// Generate histogram data from samples
std::random_device rd;
std::mt19937 gen(rd());
std::normal_distribution<double> normalDist(2.0, 1.0);
const int numSamples = 1000;
std::vector<double> normalSamples;
normalSamples.reserve(numSamples);
for (int i = 0; i < numSamples; i++) {
normalSamples.push_back(normalDist(gen));
}
// Create traces for continuous distributions
{"x", x},
{"y", normalY},
{"mode", "lines"},
{"name", "Normal(μ=2, σ=1)"},
{"line", {{"color", "blue"}, {"width", 3}}}};
plotly::Object exponentialTrace = {
{"type", "scatter"},
{"x", x},
{"y", exponentialY},
{"mode", "lines"},
{"name", "Exponential(λ=0.5)"},
{"line", {{"color", "red"}, {"width", 3}}}};
{"x", x},
{"y", gammaY},
{"mode", "lines"},
{"name", "Gamma(k=2, θ=1.5)"},
{"line", {{"color", "green"}, {"width", 3}}}};
// Create histogram trace for normal samples
{"x", normalSamples},
{"name", "Normal Samples (n=1000)"},
{"opacity", 0.4},
{"marker", {{"color", "lightblue"}}},
{"yaxis", "y2"},
{"histnorm", "probability density"}};
// Create layout with dual y-axes
plotly::Object layout = {{"title",
{{"text", "Statistical Distributions Comparison"},
{"font", {{"size", 18}}}}},
{"xaxis", {{"title", "x"}, {"showgrid", true}}},
{"yaxis",
{{"title", "Probability Density Function"},
{"showgrid", true},
{"domain", {0.0, 0.7}}}},
{"yaxis2",
{{"title", "Sample Frequency"},
{"domain", {0.75, 1.0}},
{"side", "right"}}},
{"width", 900},
{"height", 700},
{"showlegend", true},
{"legend", {{"x", 0.7}, {"y", 0.9}}}};
// Create the plot
std::vector<plotly::Object> data = {normalTrace, exponentialTrace, gammaTrace,
histogramTrace};
fig.newPlot(data, layout);
if (!args.headless) {
fig.waitClose();
} else {
// Save image instead of opening browser
{"width", 900},
{"height", 700},
{"filename", "statistical_distributions"}};
fig.downloadImage(imageOpts);
}
return 0;
}
auto parseGalleryArgs(int argc, char *argv[]) -> GalleryArgs
Parse command line arguments for gallery examples.
Definition arg_parser.cpp:4
void waitClose() const
Wait until the figure is closed (no client connected).
Definition plotly.cpp:406
auto downloadImage(const Object &opts=Object()) -> bool
Download the figure as an image.
Definition plotly.cpp:413
auto newPlot(const Object &data, const Object &layout=Object(), const Object &config=Object()) -> bool
Create and render a new plot.
Definition plotly.cpp:408
auto openBrowser(bool headless=false) -> bool
Open the figure in the browser.
Definition plotly.cpp:529
auto gammaPDF(double x, double shape, double scale) -> double
Definition gallery_statistical_distributions.cpp:77
auto normalPDF(double x, double mean, double stddev) -> double
Definition gallery_statistical_distributions.cpp:67
auto exponentialPDF(double x, double lambda) -> double
Definition gallery_statistical_distributions.cpp:73
auto linspace(double a, double b, int n) -> std::vector< double >
Create a linearly spaced vector of values between two endpoints.
Definition linspace.cpp:4
Public Plotly C++ API header.