Loading...
Searching...
No Matches
gallery_star.cpp
This gallery example demonstrates creating custom geometric shapes using Plotly.cpp by generating coordinate points programmatically. It showcases the creation of a five-pointed star through mathematical coordinate calculation and path-based visualization.
Features demonstrated:
- Custom geometric shape generation using mathematical calculations
- Polar coordinate conversion to Cartesian coordinates
- Path closure for complete shape formation
- Scatter plot with both lines and markers for shape definition
- Equal axis scaling to maintain shape proportions
- Custom styling with color differentiation for lines and markers
- Helper function design for reusable shape generation
Mathematical concepts:
- Star geometry with alternating outer and inner radii
- Angular positioning using multiples of

- Polar-to-Cartesian coordinate transformation:


- Path completion by connecting back to the starting point


The star shape is created with outer radius 1.0, inner radius 0.4, and centered at the origin, demonstrating precise geometric control through programmatic coordinate generation.
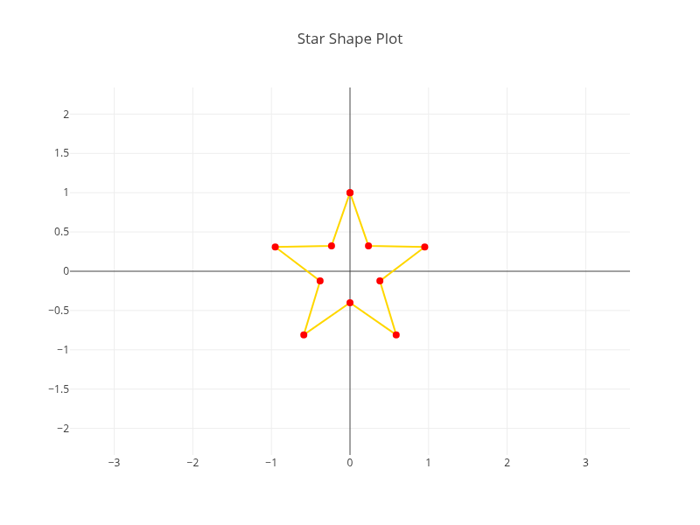
Five-Pointed Star Geometric Shape
#include "plotly/plotly.hpp"
#include "utils/arg_parser.hpp"
#include <cmath>
#include <utility>
#include <vector>
-> std::pair<std::vector<double>, std::vector<double>> {
std::vector<double> x;
std::vector<double> y;
const double angle = M_PI / 5.0; // 36 degrees
for (int i = 0; i < 10; i++) {
double r = (i % 2 == 0) ? rOuter : rInner;
double theta = (i * angle) + M_PI / 2.0; // start from top
double xPoint = cx + (r * std::cos(theta));
double yPoint = cy + (r * std::sin(theta));
x.push_back(xPoint);
y.push_back(yPoint);
}
// Close the path by adding the first point again
x.push_back(x[0]);
y.push_back(y[0]);
return std::make_pair(x, y);
}
// Parse command line arguments
plotly::Figure fig;
fig.openBrowser(args.headless);
// Create star shape with center at (0,0), outer radius 1, inner radius 0.4
auto [x, y] = createStarShape(0.0, 0.0, 1.0, 0.4);
{"y", y},
{"type", "scatter"},
{"mode", "lines+markers"},
{"line", {{"shape", "linear"}, {"color", "gold"}}},
{"marker", {{"color", "red"}, {"size", 8}}}}},
{{"title", {{"text", "Star Shape Plot"}}},
{"xaxis", {{"scaleanchor", "y"}, {"range", {-1.5, 1.5}}}},
{"yaxis", {{"range", {-1.5, 1.5}}}},
{"showlegend", false}});
if (!args.headless) {
fig.waitClose();
} else {
// Save image instead of opening browser
{"width", 800},
{"height", 600},
{"filename", "star"}};
fig.downloadImage(imageOpts);
}
return 0;
}
auto parseGalleryArgs(int argc, char *argv[]) -> GalleryArgs
Parse command line arguments for gallery examples.
Definition arg_parser.cpp:4
void waitClose() const
Wait until the figure is closed (no client connected).
Definition plotly.cpp:406
auto downloadImage(const Object &opts=Object()) -> bool
Download the figure as an image.
Definition plotly.cpp:413
auto newPlot(const Object &data, const Object &layout=Object(), const Object &config=Object()) -> bool
Create and render a new plot.
Definition plotly.cpp:408
auto openBrowser(bool headless=false) -> bool
Open the figure in the browser.
Definition plotly.cpp:529
auto createStarShape(double cx, double cy, double rOuter, double rInner) -> std::pair< std::vector< double >, std::vector< double > >
Definition gallery_star.cpp:48
Public Plotly C++ API header.