Loading...
Searching...
No Matches
gallery_parallel_coordinates.cpp
This gallery example demonstrates creating a parallel coordinates plot using Plotly.cpp. Parallel coordinates are effective for visualizing multi-dimensional data by representing each data point as a line connecting values across multiple parallel axes.
Features demonstrated:
- Multi-dimensional data visualization using parallel coordinates
- Custom dimension configuration with ranges and constraints
- Interactive brushing and filtering capabilities
- Custom tick values and labels for categorical data
- Constraint ranges for data filtering on specific dimensions
- Color coding of parallel lines for pattern identification
The plot displays four dimensions (A, B, C, D) with different configurations:
- Dimension A: Numeric range with constraint filtering
- Dimension B: Custom tick positions for specific value highlighting
- Dimension C: Custom text labels replacing numeric values
- Dimension D: Standard numeric range without constraints
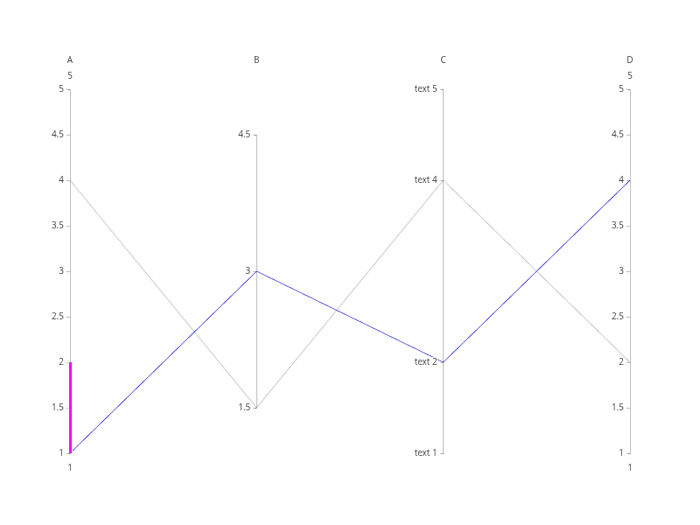
Multi-Dimensional Parallel Coordinates
Plot"
#include "plotly/plotly.hpp"
#include "utils/arg_parser.hpp"
#include <vector>
// Parse command line arguments
// Create a plotly figure
plotly::Figure fig;
fig.openBrowser(args.headless);
// Create the parallel coordinates trace
plotly::Object trace = {
{"type", "parcoords"},
{"line", {{"color", "blue"}}},
{"dimensions",
{{{"range", {1, 5}},
{"constraintrange", {1, 2}},
{"label", "A"},
{"values", {1, 4}}},
{{"range", {1, 5}},
{"label", "B"},
{"values", {3, 1.5}},
{"tickvals", {1.5, 3, 4.5}}},
{{"range", {1, 5}},
{"label", "C"},
{"values", {2, 4}},
{"tickvals", {1, 2, 4, 5}},
{"ticktext", {"text 1", "text 2", "text 4", "text 5"}}},
{{"range", {1, 5}}, {"label", "D"}, {"values", {4, 2}}}}}};
// Create the plot
std::vector<plotly::Object> data = {trace};
fig.newPlot(data);
if (!args.headless) {
fig.waitClose();
} else {
// Save image instead of opening browser
{"width", 800},
{"height", 600},
{"filename", "parallel_coordinates"}};
fig.downloadImage(imageOpts);
}
return 0;
}
auto parseGalleryArgs(int argc, char *argv[]) -> GalleryArgs
Parse command line arguments for gallery examples.
Definition arg_parser.cpp:4
void waitClose() const
Wait until the figure is closed (no client connected).
Definition plotly.cpp:406
auto downloadImage(const Object &opts=Object()) -> bool
Download the figure as an image.
Definition plotly.cpp:413
auto newPlot(const Object &data, const Object &layout=Object(), const Object &config=Object()) -> bool
Create and render a new plot.
Definition plotly.cpp:408
auto openBrowser(bool headless=false) -> bool
Open the figure in the browser.
Definition plotly.cpp:529
Public Plotly C++ API header.