Loading...
Searching...
No Matches
gallery_geographic_choropleth.cpp
Geographic Choropleth Map Example
This example demonstrates creating professional geographic data visualizations using choropleth maps to show statistical data across countries. It visualizes world GDP per capita distribution using color-coded country regions with interactive hover information and detailed geographic styling.
What You'll Learn
- Creating choropleth maps for geographic data visualization
- Working with ISO 3-letter country codes for location mapping
- Implementing custom color scales for data representation
- Configuring geographic projections and map styling
- Adding interactive hover templates with detailed country information
- Customizing map features (coastlines, oceans, lakes, rivers)
- Professional map layout design with annotations
Sample Output
The example creates a comprehensive world map featuring:
- World GDP per capita data for 40+ countries using ISO-3 codes
- Purple-to-yellow color gradient representing economic data ranges
- Natural Earth projection for aesthetically pleasing world view
- Interactive hover showing country name, GDP value, and country code
- Styled coastlines, oceans, and geographic features
- Professional layout suitable for economic analysis presentations
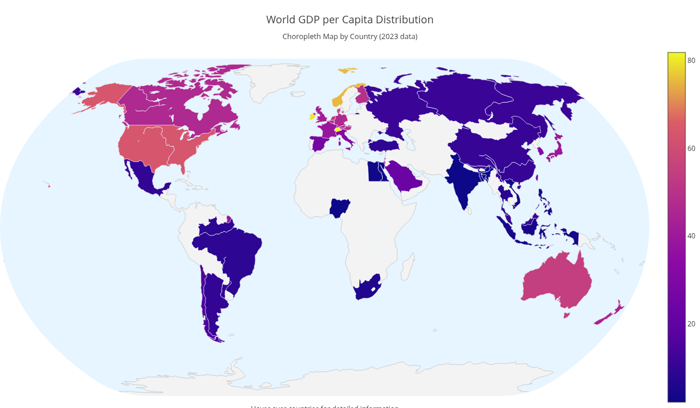
World GDP per Capita Choropleth Map
- See also
- plotly::Object For choropleth trace configuration
- parseGalleryArgs() For command line argument handling
#include "plotly/plotly.hpp"
#include "utils/arg_parser.hpp"
#include <string>
#include <vector>
// Parse command line arguments
plotly::Figure fig;
fig.openBrowser(args.headless);
// Country codes (ISO 3-letter) and corresponding data
std::vector<std::string> countries = {
"USA", "CHN", "JPN", "DEU", "IND", "GBR", "FRA", "ITA", "BRA", "CAN",
"RUS", "KOR", "AUS", "ESP", "MEX", "IDN", "NLD", "SAU", "TUR", "TWN",
"CHE", "BEL", "IRL", "ISR", "AUT", "NGA", "THA", "EGY", "ZAF", "ARG",
"NOR", "PHL", "BGD", "VNM", "CHL", "FIN", "SGP", "MYS", "DNK", "NZL"};
// GDP per capita data (in thousands USD)
std::vector<double> gdpPerCapita = {
63.5, 10.5, 39.3, 46.3, 2.1, 42.3, 38.6, 31.3, 8.7, 46.2,
11.3, 31.8, 54.9, 27.1, 9.9, 4.1, 52.3, 23.1, 9.1, 25.9,
81.9, 47.2, 79.9, 43.6, 48.1, 2.2, 7.8, 3.0, 6.0, 10.0,
75.4, 3.5, 2.5, 3.8, 15.3, 48.8, 65.2, 11.4, 59.8, 44.0};
// Country names for hover display
std::vector<std::string> countryNames = {
"United States", "China", "Japan", "Germany",
"India", "United Kingdom", "France", "Italy",
"Brazil", "Canada", "Russia", "South Korea",
"Australia", "Spain", "Mexico", "Indonesia",
"Netherlands", "Saudi Arabia", "Turkey", "Taiwan",
"Switzerland", "Belgium", "Ireland", "Israel",
"Austria", "Nigeria", "Thailand", "Egypt",
"South Africa", "Argentina", "Norway", "Philippines",
"Bangladesh", "Vietnam", "Chile", "Finland",
"Singapore", "Malaysia", "Denmark", "New Zealand"};
// Create choropleth trace
plotly::Object trace = {
{"type", "choropleth"},
{"locations", countries},
{"z", gdpPerCapita},
{"text", countryNames},
{"locationmode", "ISO-3"},
{"colorscale",
{{0.0, "#0d0887"},
{0.2, "#5b02a3"},
{0.4, "#8b0aa5"},
{0.6, "#b93289"},
{0.8, "#db5c68"},
{1.0, "#f0f921"}}},
{"colorbar",
{{"title", "GDP per Capita<br>(thousands USD)"},
{"titleside", "right"},
{"tickmode", "linear"},
{"tick0", 0},
{"dtick", 20}}},
{"hovertemplate", "<b>%{text}</b><br>" +
std::string("GDP per Capita: $%{z:,.1f}k<br>") +
"Country Code: %{location}<extra></extra>"},
{"marker", {{"line", {{"color", "white"}, {"width", 0.5}}}}}};
// Create layout with geographic projection
plotly::Object layout = {
{"title",
{{"text",
"World GDP per Capita Distribution<br>" +
std::string("<sub>Choropleth Map by Country (2023 data)</sub>")},
{"font", {{"size", 18}}}}},
{"geo",
{{"showframe", false},
{"showcoastlines", true},
{"coastlinecolor", "rgb(204, 204, 204)"},
{"projection", {{"type", "natural earth"}}},
{"showland", true},
{"landcolor", "rgb(243, 243, 243)"},
{"showocean", true},
{"oceancolor", "rgb(230, 245, 255)"},
{"showlakes", true},
{"lakecolor", "rgb(230, 245, 255)"},
{"showrivers", true},
{"rivercolor", "rgb(230, 245, 255)"}}},
{"width", 1200},
{"height", 700},
{"margin", {{"l", 0}, {"r", 0}, {"t", 80}, {"b", 0}}},
{"annotations",
{{{"text", "Hover over countries for detailed information"},
{"x", 0.5},
{"y", -0.02},
{"xref", "paper"},
{"yref", "paper"},
{"showarrow", false},
{"font", {{"size", 12}}}}}}};
// Create the plot
std::vector<plotly::Object> data = {trace};
fig.newPlot(data, layout);
if (!args.headless) {
fig.waitClose();
} else {
// Save image instead of opening browser
{"width", 1200},
{"height", 700},
{"filename", "geographic_choropleth"}};
fig.downloadImage(imageOpts);
}
return 0;
}
auto parseGalleryArgs(int argc, char *argv[]) -> GalleryArgs
Parse command line arguments for gallery examples.
Definition arg_parser.cpp:4
void waitClose() const
Wait until the figure is closed (no client connected).
Definition plotly.cpp:406
auto downloadImage(const Object &opts=Object()) -> bool
Download the figure as an image.
Definition plotly.cpp:413
auto newPlot(const Object &data, const Object &layout=Object(), const Object &config=Object()) -> bool
Create and render a new plot.
Definition plotly.cpp:408
auto openBrowser(bool headless=false) -> bool
Open the figure in the browser.
Definition plotly.cpp:529
Public Plotly C++ API header.