Loading...
Searching...
No Matches
gallery_fractal.cpp
Fractal Visualization Example
This example demonstrates advanced mathematical visualization by computing and displaying the famous Mandelbrot and Julia fractals. It showcases complex number calculations, iterative algorithms, and interactive switching between different fractal types using Plotly's update menu functionality.
What You'll Learn
- Mathematical fractal generation using complex number arithmetic
- Implementing the Mandelbrot set iterative escape algorithm
- Computing Julia sets with different parameter values
- Creating interactive heatmap visualizations of mathematical data
- Using Plotly's update menu buttons for switching between datasets
- Color mapping iterations to create visually appealing mathematical art
- Complex plane coordinate system visualization
Sample Output
The example creates an interactive fractal explorer featuring:
- Mandelbrot set visualization with "Hot" colorscale showing iteration counts
- Julia set with parameter

- Interactive buttons to switch between the two fractal types
- 400x400 pixel resolution showing intricate fractal boundary details
- Hover information displaying complex coordinates and iteration values

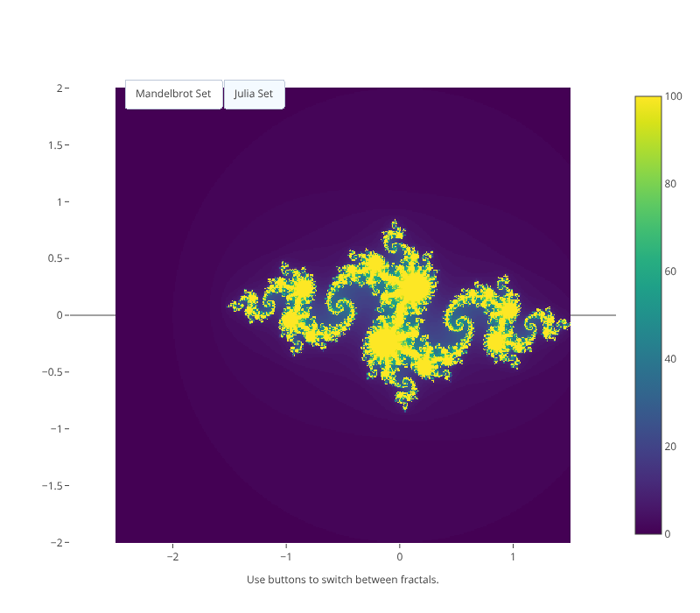
Julia Set Fractal Visualization
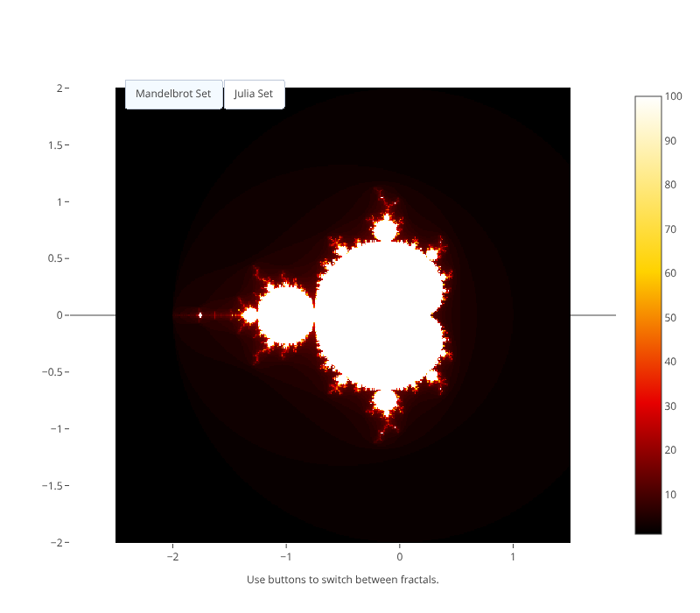
Mandelbrot and Julia Set Fractal
Visualization"
- See also
- std::complex For complex number arithmetic
- plotly::Object For heatmap trace configuration with update menus
#include "plotly/plotly.hpp"
#include <complex>
#include <cstdlib>
#include <iostream>
#include <string>
#include <vector>
// Mandelbrot set calculation
std::complex<double> z = 0;
for (int i = 0; i < maxIter; i++) {
if (std::abs(z) > 2.0) {
return i;
}
z = z * z + c;
}
return maxIter;
}
// Julia set calculation
int maxIter) -> int {
std::complex<double> current = z;
for (int i = 0; i < maxIter; i++) {
if (std::abs(current) > 2.0) {
return i;
}
current = current * current + c;
}
return maxIter;
}
plotly::Figure fig;
fig.openBrowser();
// Initial parameters
const int width = 400;
const int height = 400;
const int maxIterations = 100;
double xMin = -2.5, xMax = 1.5, yMin = -2.0, yMax = 2.0;
// Julia set parameter
std::complex<double> juliaC(-0.8, 0.156);
// Generate initial Mandelbrot set
std::vector<std::vector<int>> mandelbrotData(height, std::vector<int>(width));
std::vector<double> xCoords, yCoords;
// Create coordinate arrays
for (int i = 0; i < width; i++) {
xCoords.push_back(xMin + (xMax - xMin) * i / (width - 1));
}
for (int j = 0; j < height; j++) {
yCoords.push_back(yMin + (yMax - yMin) * j / (height - 1));
}
// Calculate Mandelbrot set
std::cout << "Calculating Mandelbrot set..." << '\n';
for (int j = 0; j < height; j++) {
for (int i = 0; i < width; i++) {
std::complex<double> c(xCoords[i], yCoords[j]);
mandelbrotData[j][i] = mandelbrot(c, maxIterations);
}
if (j % 50 == 0) {
std::cout << "Progress: " << (j * 100 / height) << "%" << '\n';
}
}
// Create Mandelbrot trace
plotly::Object mandelbrotTrace = {
{"type", "heatmap"},
{"z", mandelbrotData},
{"x", xCoords},
{"y", yCoords},
{"colorscale", "Hot"},
{"showscale", true},
{"colorbar", {{"title", "Iterations"}, {"titleside", "right"}}},
{"name", "Mandelbrot Set"},
{"hovertemplate", "Real: %{x:.4f}<br>Imaginary: %{y:.4f}<br>" +
std::string("Iterations: %{z}<extra></extra>")}};
// Generate Julia set for comparison
std::vector<std::vector<int>> juliaData(height, std::vector<int>(width));
std::cout << "Calculating Julia set..." << '\n';
for (int j = 0; j < height; j++) {
for (int i = 0; i < width; i++) {
std::complex<double> z(xCoords[i], yCoords[j]);
juliaData[j][i] = julia(z, juliaC, maxIterations);
}
}
// Create Julia trace (initially invisible)
plotly::Object juliaTrace = {
{"type", "heatmap"},
{"z", juliaData},
{"x", xCoords},
{"y", yCoords},
{"colorscale", "Viridis"},
{"showscale", true},
{"visible", false},
{"colorbar", {{"title", "Iterations"}, {"titleside", "right"}}},
{"name", "Julia Set"},
{"hovertemplate", "Real: %{x:.4f}<br>Imaginary: %{y:.4f}<br>" +
std::string("Iterations: %{z}<extra></extra>")}};
// Create layout with buttons to switch between fractals
plotly::Object layout = {
{"title",
{{"text",
"Fractal<br>" + std::string("<sub>Click buttons to switch between "
"Mandelbrot and Julia sets</sub>")},
{"font", {{"size", 16}}}}},
{"xaxis", {{"title", "Real Axis"}, {"showgrid", false}}},
{"yaxis",
{{"title", "Imaginary Axis"},
{"showgrid", false},
{"scaleanchor", "x"}}},
{"width", 800},
{"height", 700},
{"updatemenus",
{{{"type", "buttons"},
{"direction", "left"},
{"showactive", true},
{"x", 0.1},
{"y", 1.02},
{"xanchor", "left"},
{"yanchor", "top"},
{"buttons",
{{{"label", "Mandelbrot Set"},
{"method", "update"},
{"args",
{{{"visible", {true, false}}},
{{"title", "Mandelbrot Set - The Classic Fractal"}}}}},
{{"label", "Julia Set"},
{"method", "update"},
{"args",
{{{"visible", {false, true}}},
{{"title", "Julia Set - c = -0.8 + 0.156i"}}}}}}}}}},
{"annotations",
{{{"text", "Use buttons to switch between fractals."},
{"x", 0.5},
{"y", -0.1},
{"xref", "paper"},
{"yref", "paper"},
{"showarrow", false},
{"font", {{"size", 12}}}}}}};
// Create the plot
std::vector<plotly::Object> data = {mandelbrotTrace, juliaTrace};
fig.newPlot(data, layout);
fig.waitClose();
return 0;
}
void waitClose() const
Wait until the figure is closed (no client connected).
Definition plotly.cpp:406
auto newPlot(const Object &data, const Object &layout=Object(), const Object &config=Object()) -> bool
Create and render a new plot.
Definition plotly.cpp:408
auto openBrowser(bool headless=false) -> bool
Open the figure in the browser.
Definition plotly.cpp:529
auto mandelbrot(const std::complex< double > &c, int maxIter) -> int
Definition gallery_fractal.cpp:50
auto julia(const std::complex< double > &z, const std::complex< double > &c, int maxIter) -> int
Definition gallery_fractal.cpp:62
Public Plotly C++ API header.