Loading...
Searching...
No Matches
gallery_box_violin_plots.cpp
Box and Violin Plots Example
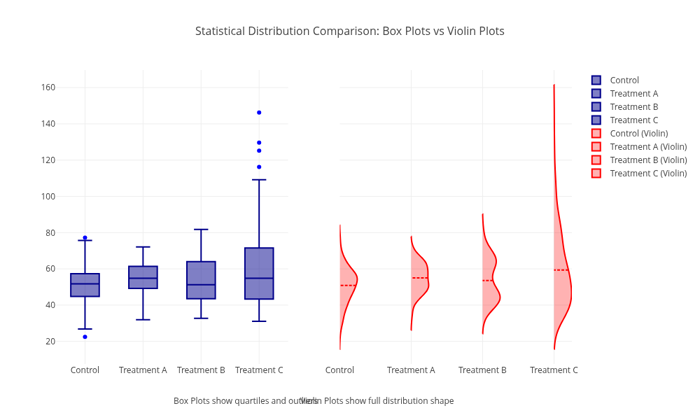
This example demonstrates advanced statistical visualization by comparing box plots and violin plots side-by-side, showing how different plot types reveal different aspects of data distribution patterns including outliers, quartiles, and density shapes.
What You'll Learn
- Creating box plots with quartile statistics and outlier detection
- Generating violin plots to visualize full probability density functions
- Comparing multiple statistical distributions with different characteristics
- Using subplots to display complementary visualization techniques
- Generating synthetic data with various statistical distributions (normal, bimodal, gamma)
- Configuring advanced plot styling and annotations for statistical clarity
Sample Output
The example creates side-by-side comparison plots showing four treatment groups:
- Control group: Normal distribution (μ=50, σ=10)
- Treatment A: Shifted normal distribution (μ=55, σ=8)
- Treatment B: Bimodal distribution with two peaks at 45 and 65
- Treatment C: Right-skewed gamma distribution starting at 30
- Left panel: Box plots highlighting quartiles, medians, and outliers
- Right panel: Violin plots showing complete distribution shapes and density curves
Box and Violin Plots Comparison Output
- See also
- plotly::Figure For the main plotting interface
#include "plotly/plotly.hpp"
#include "utils/arg_parser.hpp"
#include <cstddef>
#include <random>
#include <string>
#include <vector>
// Parse command line arguments
plotly::Figure fig;
fig.openBrowser(args.headless);
// Generate sample data for different groups
std::random_device rd;
std::mt19937 gen(rd());
const int sampleSize = 200;
std::vector<std::string> groups = {"Control", "Treatment A", "Treatment B",
"Treatment C"};
std::vector<plotly::Object> boxTraces, violinTraces;
for (size_t i = 0; i < groups.size(); i++) {
std::vector<double> data;
data.reserve(sampleSize);
// Generate different distributions for each group
if (i == 0) {
// Control: Normal distribution
std::normal_distribution<double> dist(50.0, 10.0);
for (int j = 0; j < sampleSize; j++) {
data.push_back(dist(gen));
}
} else if (i == 1) {
// Treatment A: Slightly shifted normal
std::normal_distribution<double> dist(55.0, 8.0);
for (int j = 0; j < sampleSize; j++) {
data.push_back(dist(gen));
}
} else if (i == 2) {
// Treatment B: Bimodal distribution
std::normal_distribution<double> dist1(45.0, 5.0);
std::normal_distribution<double> dist2(65.0, 5.0);
std::bernoulli_distribution chooseDist(0.6);
for (int j = 0; j < sampleSize; j++) {
if (chooseDist(gen)) {
data.push_back(dist1(gen));
} else {
data.push_back(dist2(gen));
}
}
} else {
// Treatment C: Skewed distribution
std::gamma_distribution<double> dist(2.0, 15.0);
for (int j = 0; j < sampleSize; j++) {
data.push_back(dist(gen) + 30.0);
}
}
// Create box plot trace
plotly::Object boxTrace = {
{"type", "box"},
{"y", data},
{"name", groups[i]},
{"x", std::vector<std::string>(data.size(), groups[i])},
{"boxpoints", "outliers"},
{"marker", {{"color", "blue"}}},
{"line", {{"color", "darkblue"}}},
{"xaxis", "x"},
{"offsetgroup", i}};
// Create violin plot trace
plotly::Object violinTrace = {
{"type", "violin"},
{"y", data},
{"name", groups[i] + " (Violin)"},
{"x", std::vector<std::string>(data.size(), groups[i])},
{"side", "positive"},
{"line", {{"color", "red"}}},
{"fillcolor", "rgba(255,0,0,0.3)"},
{"meanline", {{"visible", true}}},
{"points", false},
{"xaxis", "x2"},
{"offsetgroup", i},
{"showlegend", true}};
boxTraces.push_back(boxTrace);
violinTraces.push_back(violinTrace);
}
// Combine all traces
std::vector<plotly::Object> allTraces;
allTraces.reserve(boxTraces.size());
for (const auto &trace : boxTraces) {
allTraces.push_back(trace);
}
for (const auto &trace : violinTraces) {
allTraces.push_back(trace);
}
// Create layout with subplot structure
plotly::Object layout = {
{"title",
{{"text",
"Statistical Distribution Comparison: Box Plots vs Violin Plots"},
{"font", {{"size", 16}}}}},
{"xaxis",
{{"title", "Box Plots"}, {"domain", {0.0, 0.45}}, {"showgrid", true}}},
{"xaxis2",
{{"title", "Violin Plots"},
{"domain", {0.55, 1.0}},
{"showgrid", true}}},
{"yaxis", {{"title", "Response Value"}, {"showgrid", true}}},
{"width", 1000},
{"height", 600},
{"showlegend", true},
{"legend", {{"x", 1.02}, {"y", 1.0}}},
{"annotations",
{{{"text", "Box Plots show quartiles and outliers"},
{"x", 0.225},
{"y", -0.15},
{"xref", "paper"},
{"yref", "paper"},
{"showarrow", false},
{"font", {{"size", 12}}}},
{{"text", "Violin Plots show full distribution shape"},
{"x", 0.775},
{"y", -0.15},
{"xref", "paper"},
{"yref", "paper"},
{"showarrow", false},
{"font", {{"size", 12}}}}}}};
// Create the plot
fig.newPlot(allTraces, layout);
if (!args.headless) {
fig.waitClose();
} else {
// Save image instead of opening browser
{"width", 1000},
{"height", 600},
{"filename", "box_violin_plots"}};
fig.downloadImage(imageOpts);
}
return 0;
}
auto parseGalleryArgs(int argc, char *argv[]) -> GalleryArgs
Parse command line arguments for gallery examples.
Definition arg_parser.cpp:4
void waitClose() const
Wait until the figure is closed (no client connected).
Definition plotly.cpp:406
auto downloadImage(const Object &opts=Object()) -> bool
Download the figure as an image.
Definition plotly.cpp:413
auto newPlot(const Object &data, const Object &layout=Object(), const Object &config=Object()) -> bool
Create and render a new plot.
Definition plotly.cpp:408
auto openBrowser(bool headless=false) -> bool
Open the figure in the browser.
Definition plotly.cpp:529
Public Plotly C++ API header.